
darvastracker.com
Darvas Box Research
Last update:
2026-10-09
Darvas Box Research
Track live Darvas Box breakout signals across 219 stocks and ETFs. Every setup is volume-confirmed and graded A-D based on 9468 historical signals since 1995. Updated nightly.
DarvasTracker scans the tracked universe for Darvas Box formations and identifies breakouts above the established box high. A breakout is volume-confirmed when trading volume reaches at least 1.5x the 20-day average. Each confirmed breakout signal is assigned a Grade from A to D and subsequently tracked against predefined targets, stop loss and historical outcome measures.
Performance is measured at predefined time intervals after the breakout. P20, P30 and P60 represent the percentage return 20, 30 and 60 trading days after the signal, respectively, provided that the position has not reached its stop loss before that measurement point. This allows the scanner to distinguish between short-term and longer-term breakout performance while excluding signals that had already failed.
Volume-confirmed breakouts only. Grade reflects 5-year historical system performance for each symbol. Filter by grade to find setups matching your strategy.
| Symbol | Grade | Box age | Perf. / breakout | Status |
|---|---|---|---|---|
| PLTR | B | 10d | 1d since breakout | Open |
| RXRX | D | 10d | -3.1% | HT1 |
| BUG | D | 7d | +0.4% | Open |
| ARTY | B | 8d | -2.4% | Open |
| XLK | B | 7d | +1.0% | HT1 |
| FORM | A | 33d | -8.2% | Open |
| UNG | D | 6d | -3.6% | HT1 |
| IONQ | A | 3d | +5.7% | HT1 |
| LSCC | A | 9d | +9.4% | HT1 |
| EEMA | D | 10d | -5.0% | SL |
Automatically selected from today's Grade A equity setups. Use the search to analyze any of the 219 tracked symbols.
| Age | N | P30 | P60 | HT1% | HT2% |
|---|---|---|---|---|---|
| 1-5 | 7 | +6.0% | +16.5% | 100.0% | 71.4% |
| 6-10 | 21 | +4.5% | +7.1% | 95.2% | 61.9% |
| 11-20 | 17 | -0.0% | -3.3% | 82.4% | 52.9% |
| 21-40 | 6 | -1.7% | +16.6% | 66.7% | 16.7% |
| 41-60 | 1 | +12.3% | +17.1% | 100.0% | 0.0% |
| Date | Close | BA | Days | P20 | P30 | P60 | Hit |
|---|---|---|---|---|---|---|---|
| 30.09.2026 | 149.31 | 33 | - | -8.2% | -8.2% | -8.2% | - |
| 08.04.2026 | 117.80 | 8 | 9 | +26.6% | +6.4% | +0.7% | HT2 |
| 13.01.2026 | 72.55 | 5 | 2 | +32.4% | +34.7% | +70.6% | HT2 |
| 29.10.2025 | 47.72 | 6 | 1 | +12.8% | +21.8% | +54.6% | HT2 |
| 01.10.2025 | 38.71 | 10 | 20 | +23.3% | +33.4% | +50.0% | HT2 |
| 16.09.2025 | 31.90 | 31 | 14 | +26.2% | +33.0% | +85.7% | HT2 |
| 02.05.2024 | 51.75 | 16 | 44 | +5.7% | +11.0% | -2.4% | HT2 |
| 16.02.2021 | 50.92 | 20 | 12 | -8.4% | -15.9% | -35.1% | SL |
| 14.01.2021 | 49.54 | 26 | 10 | +1.7% | -2.3% | -0.5% | SL |
| 17.06.2020 | 30.41 | 7 | 11 | +0.4% | +1.4% | -26.2% | HT1 |
This is an automatically selected example. Use the search above to analyze any of the 219 tracked symbols.
The Darvas Box is a momentum-based trading system developed by Nicolas Darvas in the late 1950s. Darvas - a professional dancer with no formal finance training - turned $10,000 into more than $2 million over 18 months by trading stocks making new highs on rising volume. His method remains one of the few systematic approaches to momentum trading that is both simple to understand and empirically testable.
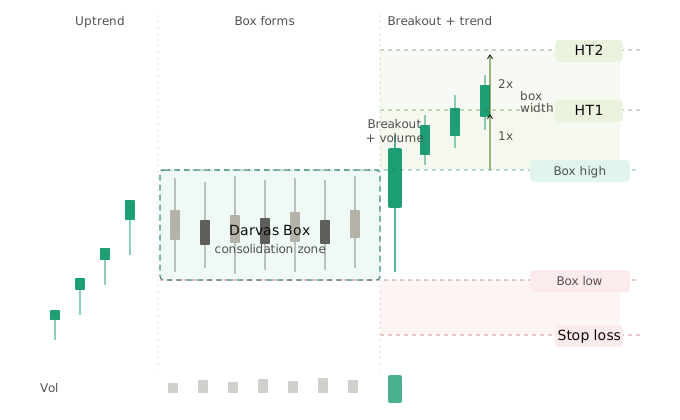
A Darvas Box forms when a stock enters a consolidation period after a strong move. The upper boundary (box high) is the highest price before consolidation, held for at least 2 sessions without being exceeded. The lower boundary (box low) is the lowest price after that high, confirmed the same way: 2 sessions without a lower low. Together they define the box. Box age - the number of trading days from the start of the formation to the day before the breakout - is one of the strongest predictors of breakout quality.
A Darvas breakout occurs when price closes above the box high. Not every breakout is equal - a surge in trading volume is required for a valid signal. Without volume, breakouts are statistically far more likely to reverse. Every signal on this site requires volume at least 1.5x the 20-day average - a non-negotiable filter that materially improves outcomes across all time horizons. Two further filters apply: breakouts are skipped when the HMA38 trend points down on the breakout day, and the box must be at least 3 trading days old.
HT1 (Hit Target 1): price reached the first upside objective, set at box width above the breakout - typically 5-15% above entry. HT2 (Hit Target 2): price continued to the second target (2x box width), representing full trend continuation. SL: stop loss triggered when price fell below the box low. Open: trade still active. Exp: open for more than 60 days without result.
Note on grade vs. HT1 rate: Grades are calculated using HMA38-based exit returns over the last 5 years - a different methodology from the HT1/HT2 targets shown in the statistics above. A Grade A symbol has demonstrated strong risk-adjusted returns using trend-following exits, which does not always correlate directly with HT1 reach rates.
Most Darvas resources describe the box but ignore box age. Very young boxes (1-5 days) lack true equilibrium. Very old boxes (60+ days) suggest fading momentum. Our data across 9468 signals identifies a clear sweet spot: boxes aged 1-5 days show the highest hit rates and strongest average P30 returns across the full dataset.
The table follows one box from the new high to the breakout, using the exact rules of this scanner: 2 sessions to confirm the box high, 2 sessions to confirm the box low, a close above the box high to trigger, and volume of at least 1.5x the 20-day average.
| Day | High | Low | Close | Volume vs 20d avg | What happens |
|---|---|---|---|---|---|
| 1 | 50.00 | 48.90 | 49.70 | 1.2x | New high at 50.00. Candidate for the box high. |
| 2 | 49.60 | 48.10 | 48.40 | 0.9x | High not exceeded (session 1 of 2). |
| 3 | 49.20 | 47.50 | 48.00 | 0.8x | High not exceeded (session 2 of 2). Box high confirmed at 50.00. New low at 47.50. |
| 4 | 48.90 | 47.80 | 48.60 | 0.7x | Low of day 3 not undercut (session 1 of 2). |
| 5 | 49.40 | 48.00 | 49.10 | 0.8x | Not undercut again (session 2 of 2). Box low confirmed at 47.50. The box is complete. |
| 6 | 49.80 | 48.70 | 49.50 | 1.0x | Close stays inside the box (47.50 to 50.00). |
| 7 | 50.90 | 49.40 | 50.60 | 1.8x | Breakout. Close above 50.00 on 1.8x volume. |
Box high 50.00, box low 47.50, box width 2.50 (5.0%), box age 5 trading days. First target (HT1) = 50.00 + 2.50 = 52.50. Second target (HT2) = 50.00 + 2 x 2.50 = 55.00. Stop loss at the box low, 47.50. The volume average covers the 20 sessions before the breakout day.
A close of 50.60 on 1.1x volume is not a signal: the volume filter requires 1.5x. A high of 50.40 with a close of 49.90 is not a signal either; it raises the box high to 50.40, and the targets move with it. A breakout while the HMA38 trend points down is skipped, as is a box younger than 3 trading days.
The following statistics are calculated from 9468 volume-confirmed Darvas Box breakout signals across 219 symbols, covering the period from 1995 to present. Our research dataset combines reconstructed historical signals with continuously recorded live signals. Historical periods are evaluated using the same Darvas Box methodology applied to current signals, while new breakouts are added to the dataset daily.
Across all 9468 signals, 83.3% reached the first target (HT1) and 58.1% the second (HT2).
Grade A symbols reach their targets about as often as Grade D (84.4% vs 82.7%), but average 4.67% after 30 days vs 2.61% for Grade D.
Individual stocks show a 84.1% hit rate vs 80.8% for the 60 ETFs in the universe.
Boxes aged 1-5 days show the highest aggregate positive hit rate at 90.6% and average P30 of 2.27%. Boxes older than 60 days show only 74.3%.
Volume-confirmed breakouts across all tracked symbols. Performance varies by market regime.
Symbols with the highest average 30-day return after a Darvas breakout, across the full signal history. Minimum 30 signals required.
| # | Symbol | Grade | Signals | HT1 rate | Avg P30 |
|---|---|---|---|---|---|
| 1 | CLSK | D | 30 | 86.7% | +23.6% |
| 2 | MSTR | A | 88 | 78.4% | +11.0% |
| 3 | SMCI | D | 47 | 91.5% | +10.3% |
| 4 | DELL | A | 32 | 96.9% | +10.0% |
| 5 | REGN | D | 70 | 81.4% | +9.2% |
| 6 | AXON | D | 78 | 91.0% | +9.2% |
| 7 | NFLX | A | 91 | 92.3% | +8.9% |
| 8 | ENPH | D | 35 | 91.4% | +8.7% |
| 9 | URNM | C | 31 | 77.4% | +8.0% |
| 10 | TSLA | B | 34 | 85.3% | +7.4% |
| 11 | NVDA | A | 72 | 86.1% | +7.1% |
| 12 | PWR | A | 56 | 92.9% | +7.0% |
| 13 | EQIX | D | 50 | 84.0% | +6.8% |
| 14 | AAPL | A | 71 | 90.1% | +6.6% |
| 15 | JBL | D | 91 | 89.0% | +6.2% |
Each symbol is graded on its 5-year signal history: hit rate, P30 median, setup frequency, and consistency across market conditions. The rolling 5-year window keeps grades relevant to current market regimes.
| Grade | Symbols | Avg hit rate | Avg P30 | Description |
|---|---|---|---|---|
| A | 43 | 84.4% | +4.7% | Consistently strong historical response |
| B | 30 | 84.5% | +2.8% | Above-average historical performance |
| C | 34 | 82.7% | +2.1% | Mixed, context-dependent results |
| D | 111 | 82.7% | +2.6% | Weak historical system fit |
Search any tracked symbol to see its current Darvas setup, historical grade, and complete signal history.
All numerical answers below are calculated nightly from the live dataset and updated automatically.
Based on our live dataset, volume-confirmed Darvas Box breakouts across 219 symbols produced a 81.9% hit rate in the 07.2025-06.2026 period, across 565 trades. The system continues to generate actionable signals, though performance varies by market regime.
Across 9468 signals in our dataset, boxes aged 1-5 days have historically produced the strongest results: a 90.6% hit rate and an average P30 return of 2.27%. Very old boxes (60+ days) show significantly weaker outcomes.
In the classic Darvas method, the box top and the box bottom are each confirmed after three consecutive days without a new high or a new low. This scanner uses 2 sessions for both, so boxes are identified slightly earlier. A box must be at least 3 trading days old before a breakout counts as a signal. All statistics on this site are based on these settings.
Across 9468 volume-confirmed breakouts since 1995, 83.3% reached the first target and 58.1% reached the second. 25.7% hit the stop loss at some point; a signal can reach its first target and later be stopped out, so these figures overlap. By year, the hit rate ranged from 77.0% to 90.4%. A high hit rate is not the same as a high return: the average return 30 trading days after a signal is 2.98%.
As of 2026-10-09, the symbols with the highest average 30-day return after a breakout are CLSK, MSTR, SMCI. Grade A symbols show an average hit rate of 84.4% compared to 82.7% for Grade D symbols, a gap of 1.7 percentage points.
HT1 is the first price target above the breakout level. HT2 is the second, higher target representing full trend continuation. In our dataset, 83.3% of all signals reached HT1. Of those, 69.8% continued to HT2.
The weakest period in our dataset was 07.2011-06.2012 with a hit rate of 77.0% across 248 trades. The strongest period was 07.2017-06.2018 with 90.4%.
A Grade A classification means a symbol has demonstrated the strongest historical response to the Darvas Box system over the most recent five years. As of 2026-10-09, 43 of the 219 tracked symbols carry a Grade A rating, with a five-year average hit rate of 84.4% and a average P30 return return of 4.67%.
Our universe includes 60 ETFs alongside individual stocks. ETFs show an average hit rate of 80.8%, compared to 84.1% for individual stocks. Sector ETFs with strong directional momentum have historically produced clean Darvas setups.
Of the 2436 stop-loss outcomes in our dataset, the average loss at P20 was -7.25%. 49.5% of stop losses were triggered within the first 10 trading days - failed breakouts tend to fail quickly.
The site tracks a curated universe of 219 US stocks and ETFs - deliberately focused on liquid, actively traded symbols with sufficient price history for statistically meaningful analysis. This universe is reviewed periodically and updated as needed..
End-of-day price data is collected after midnight UTC following US market close. All signals, grades, and statistics are then recalculated automatically. The last full recalculation was completed on 2026-10-09 at 15:53 UTC.
darvastracker.com is an independent research tool built and maintained by a private trader with over 35 years of experience in financial markets and market data infrastructure. Not affiliated with any broker, data vendor, or financial institution.
End-of-day OHLCV price data (Open, High, Low, Close, Volume) is sourced from publicly available market data providers including Yahoo Finance and other free data sources. Darvas Box signal detection, grade classification, and historical statistics are computed independently using proprietary algorithms. No AI is used in signal generation - all rules are deterministic and fully documented above. End-of-day data is collected and processed after midnight UTC, following US market close.
Disclaimer: Nothing on this site constitutes financial advice or a recommendation to buy or sell any security. Past performance is not indicative of future results. All trading involves risk.
Privacy: We use Umami for privacy-friendly, cookieless website analytics. No personal data is tracked and sent to third parties and no tracking cookies are set. All analytics data is stored locally on our own server.